Fantasy Football Wins Above Replacement (WAR) Explained
Find out the perfect fantasy football draft order in 2024. You can't do this using points. You do this with WAR.
WAR is a descriptive stat. Let’s just get that out of the way. It can’t quantitatively forecast how Saquon Barkley will do in 2025 after his high-usage juggernaut 2024 rampage. But it gives you a power no other stat can. Namely, points per game. The power to compare players across positions by rank and numeric degree. That numeric degree being in terms of your fantasy team's wins.
Here’s my 30,000-ft one paragraph sell on WAR - We’ve all heard ad nauseum that you can’t just use prior year’s points scored either by game or in total to project for the year upcoming. Things are always changing. But aside from rookies - there’s no real alternative to use as a starting point. Whatever factors you think makes the new season different moves your player valuation one way or another, but that starting point is still the bedrock. It anchors the additional factors such as team/teammate changes, age, injury, etc. This is why I think WAR is worth your time understanding. It replaces prior year points as that bedrock. Points can’t properly compare players across position or take into account how scarce that position is.
WAR does exactly this.
Do I have your curiosity? Let's drop altitude to about 15,000-ft with an example to understand WAR a little more conceptually. I'll have your attention by then.
Cross-Position Ranking
Ever wondered when exactly was the right spot to draft Travis Kelce’s in his prime years? Somewhere in the middle to end of Round 1 usually felt about right. After the big name running backs and a few wide receivers, right? Somewhere in there, anyway. You just…you know. You felt when it’s right.
But how exactly did you figure?
Your intuitive thought certainly wasn’t perfect. But it was leading you in the correct direction. Travis Kelce was worlds better than even the next best tight end in his prime. And the alternative options dried up quick if you didn’t go strong in Round 1 or maybe on the turn.
Congrats! Your brain subconsciously understood a key concept that acts as a map to compare players across positions. Key enough that I'm putting it in bold:
Positional Point Distributions
Let’s trade in Travis Kelce for a newer 2025 model. Brock Bowers is around ADP #19 with Jonathan Taylor and A.J. Brown close by. Using PPR points per-game as a starting point, Taylor averaged 17.5, Brown 16.7, and Bowers 15.5. You probably start with these figures, then contextualize the changes in scene for all three. Taylor goes from Flacco at QB to presumably Daniel Jones, and Bowers upgrades from O’Connell to an actual quarterback in Geno Smith. Meanwhile, Brown is pretty much in his same 2024 boat.
The market seems to be speaking here by having these three grouped closely in ADP. Taylor gets downgraded, Bowers upgraded, and Brown about the same. Now they're all next to each other.
But was the market using the right starting point?
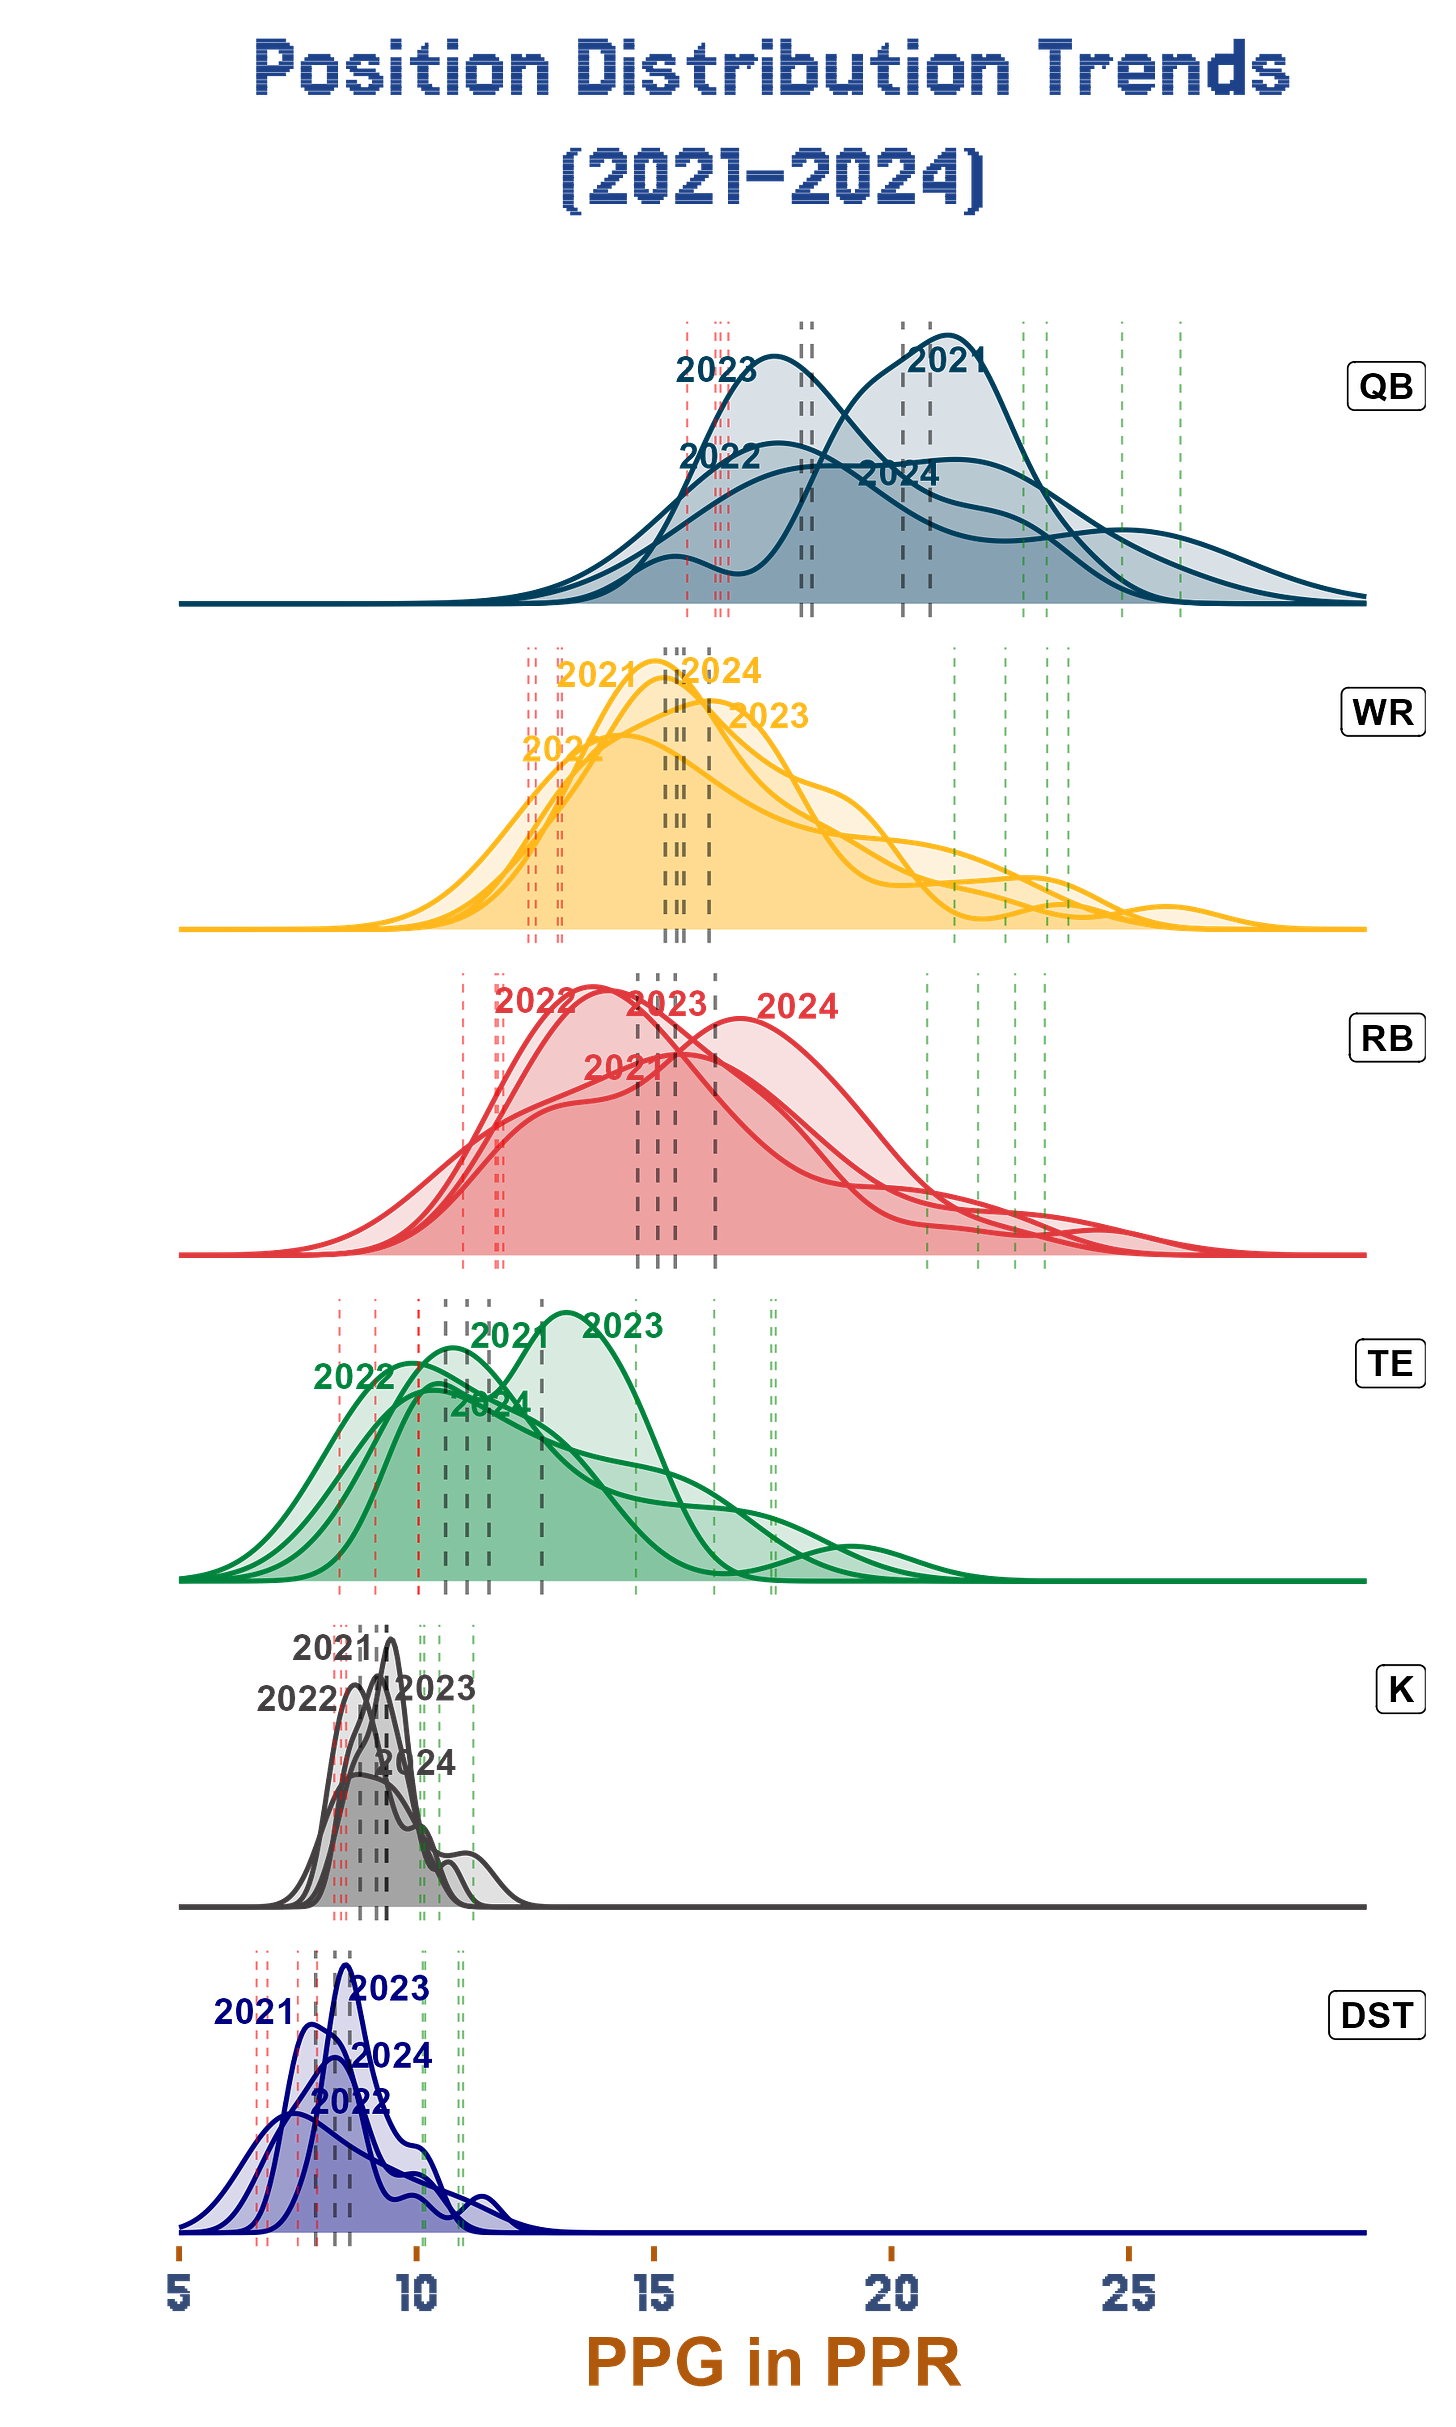
Below are position distributions for average PPR points scored in the post-COVID era. The black vertical lines represent that season’s median weekly score out of the top-12/top-24 performing players to align with what you’d reasonably expect in a 12-team single-QB PPR league. The red lines represent the lowest 2.5% of such “starting” caliber players, and green the upper 2.5%.
There are two major take-aways from this graph:
Aside from quarterback - each position’s distributions across the four years are relatively similar
Aside from running backs and wide receivers - each position’s medians are dissimilar from one another (leave out K and DST)
Back to that decision we have to make between Jonathan Taylor, A.J. Brown, and Brock Bowers. If Bowers is an elite tight end, the graph suggests we can expect him to score about 16-17 points per week in PPR. Since we only plotted the distribution of presumed starters, we don’t exactly have the figure to compare this to replacements, but let’s just go with the lower 2.5 percent for the position. Close enough for this 15,000-ft demonstration. You’re looking at about 8-9 points, for about an 8-point difference from Bowers.
What about A.J. Brown? You might value him just below the tier-1 receivers and expect him to score 20 or so per game, giving him eight-points more than a back-end wide receiver. That basically puts him even (or maybe a little behind) Bowers. And if we peg Jonathan Tayler a shade behind the elite running backs we might eye-ball that 17 PPG range for a six-point advantage over a back-end running back.
The answer seems to be clear. Take Brock Bowers. Instead of relying on PPG to start the mental evaluation process, rely on the fairly consistent pattern of position distributions. Doing so considers both the high end upside potential of the top players, and the positional scarcity scarcity to complete different positions on the same scale.
Now that I have your attention. It’s time to land to plane.
Fantasy Football WAR Model
We’ll stick with Brock Bowers. The first part of calculating WAR is deciding on league settings. I can adjust the model for whatever, but for this post I’m using 12-team full PPR leagues with your traditional flex-nine starting roster.
We first need to estimate what the average fantasy team scores. We could take the top-12/24 scoring players at each position and average that so our over the year but that's lazy and imprecise. We need a secret ingredient. An elusive and ephemeral stat to pull. One that's not readily available at any point in time. But it's the oil that allows the engine of WAR to run.
Weekly player league start percentage.
Fantasy managers change their lineup every week. So to figure out the average team score, simply take the number of league-wide starting slots for each position and find the top percentage started on a weekly basis. Average it out and there you go. Flex takes a little elbow grease, but it's no biggie. Just figure the top-12 combo WR/RB/TE left per week and average out that.
Now we have a realistic estimate to work with that reflects how things change on a weekly basis when players are benched or picked up on the wire before being started.
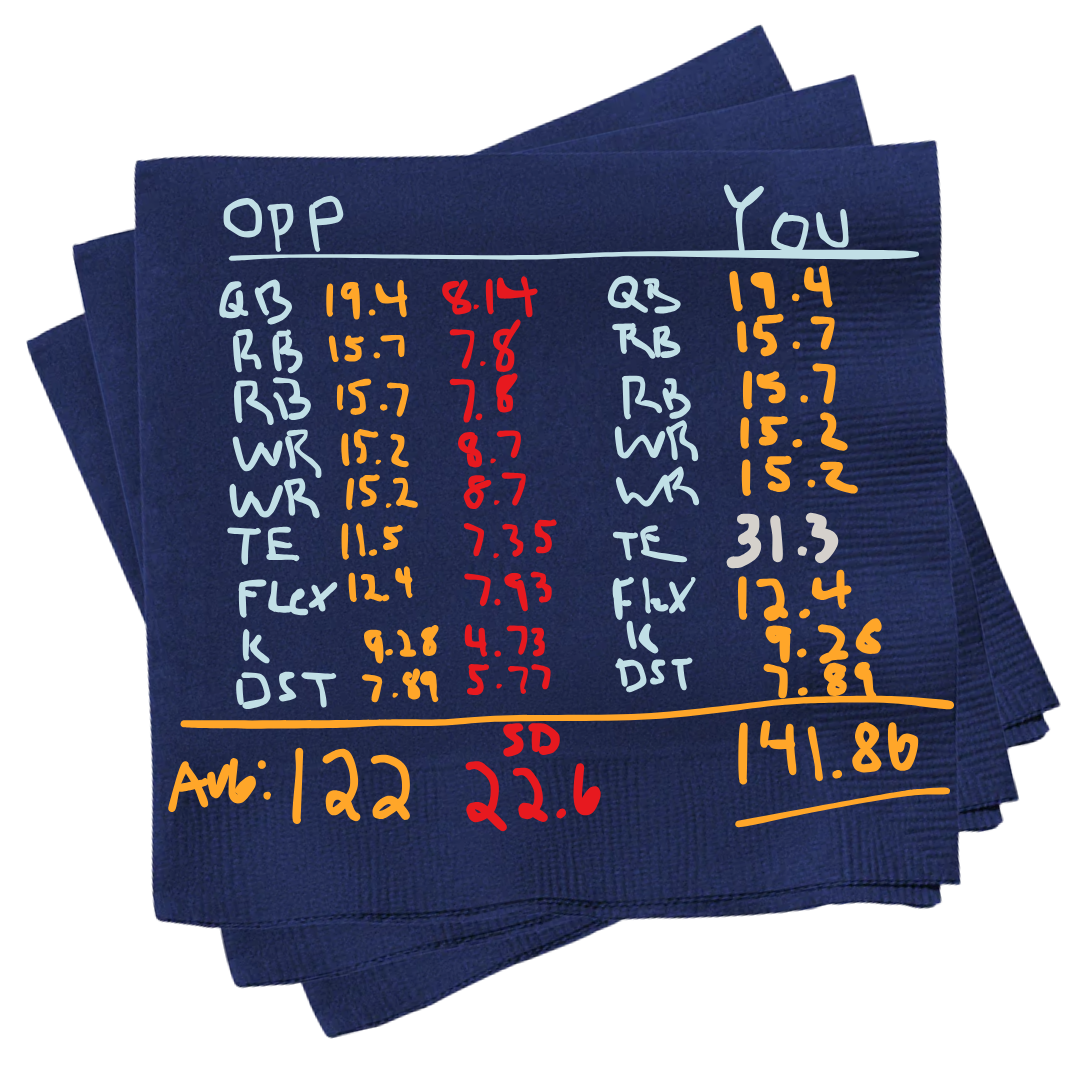
Here's the answer. The average team score and standard deviation. Both are critical. I'll write it on a cocktail napkin so we can refer back.
Now my friends - we're ready to actually do some shit. We’ll start by figuring out the odds Brock Bowers helped you win in Week 11 - his best game of the season. Just for example.
31.3 points on 13/126/1 with a random -3 rush yards.
Since we want to isolate Bowers, we need to sterilize the rest of our team and the entire opponent we face in fantasy. All that needs to be done is assume everyone else other than Bowers scores an average amount of points for their position (including flex). But we also have to take into account the variance in our opponent’s team score. As we all know, fantasy teams might average 122 but some weeks it's 155 and others it’s full on Kevin dropping the Chili for 85 or some shit.
I’m just going to order a Mezcal so we can write this all out on another napkin. Here are all the individual position averages (orange) and standard deviations (red) based on the logic we discussed.
Week 11 fantasy matchup between your team (with Bowers) vs average 12-team league opponent:
The red standard deviation figures are critical. We can’t assume 100% we’d win with Bowers just because he surpassed his position average. We need to consider the range of possible outcomes from our opponent. The formula to get the opponent’s entire team standard deviation (22.6) is found by taking the square root of the sum of all individual position standard deviation’s squares.
This is all to say the average fantasy team scores 122 points with a standard deviation of 22.6. This is enough info to build a distribution of our opponent's score expectation. And 0-141.86 points covers about 81% of it, as shown below. So that’s our odds of winning with Bowers in Week 11 vs the average opponent.
This should make some intuitive sense. Pocket aces in Hold-em gives you about an 85% chance heads up without knowing what your opponent has. That’s what a 31-spot out of your tight end earns you. And as poker players and fantasy managers both know quite well… that 15-19% comes up pretty often.
The next step is to repeat this process for every week of the fantasy season 1-17 using whatever Bowers scored in each week. The average weekly percentages multiplied by 17 returns how many fantasy matchups you’d expect to have won with Bowers in 2024.
But wait.
We can’t do this quite yet. What about his bye week? What do we plug in for that?
Let’s think this through as a fantasy manager. What do you do when your starter goes on bye or misses a game for whatever reason? You fill him in with a replacement. Well. That’s exactly what we’re going to do too.
Replacement-level player defined
What caliber player are you left with when a starter misses a game? Either someone on your bench or that week’s waiver wire wonder. And thanks to our secret ingredient - ESPN weekly player start percentages - we account for both possibilities by taking the top-3 started players at the position who were NOT considered starters for that week. So for tight end - that means the 13th - 15th most started assuming none qualified for flex in a given week.
Repeat for every week so we can find a position’s replacement average score. For tight end in PPR, that’s 8.81. Since this is our own player and we need a static number (as opposed to a range) the standard deviation isn’t important.
They say people aren’t just statistics. They have faces. They have names. Well here are those names behind this 8.81 replacement-level tight end for 2024.
Back to the napkin we go. Now we can fill out the weekly win percentages for every week, average those all out, then multiply the result by 17 to get the expected win total for a Brock Bowers owned fantasy football team.
Shout out to the fake bartender for all the pretty Sharpie colors. As you can see I used yellow to plug in that missed bye-week which we needed to complete this genetic strand of WAR DNA.
Bowers’ 9.49 wins passes the smell test. He was a huge plus and teams could expect to go either 9-8 or 10-7 including playoffs thanks to his impact.
Fam - we’re close. There’s one last step to finish this landing. We just need to run the same process on the napkin above with all 17-games set to replacement-level tight end (45% rounded). Or more simply - you can skip that and just take 45% of 17 to get the season-long win expectation for a fantasy team who only uses a replacement-level tight end.
No need for another napkin. An otherwise perfectly average fantasy football team with a replacement-level tight end throughout the entire season expects to win 7.69 games which finally gives us all we need to find Brock Bowers’ 2024 WAR. Simply subtract 7.69 from 9.49.
1.8 wins above replacement.
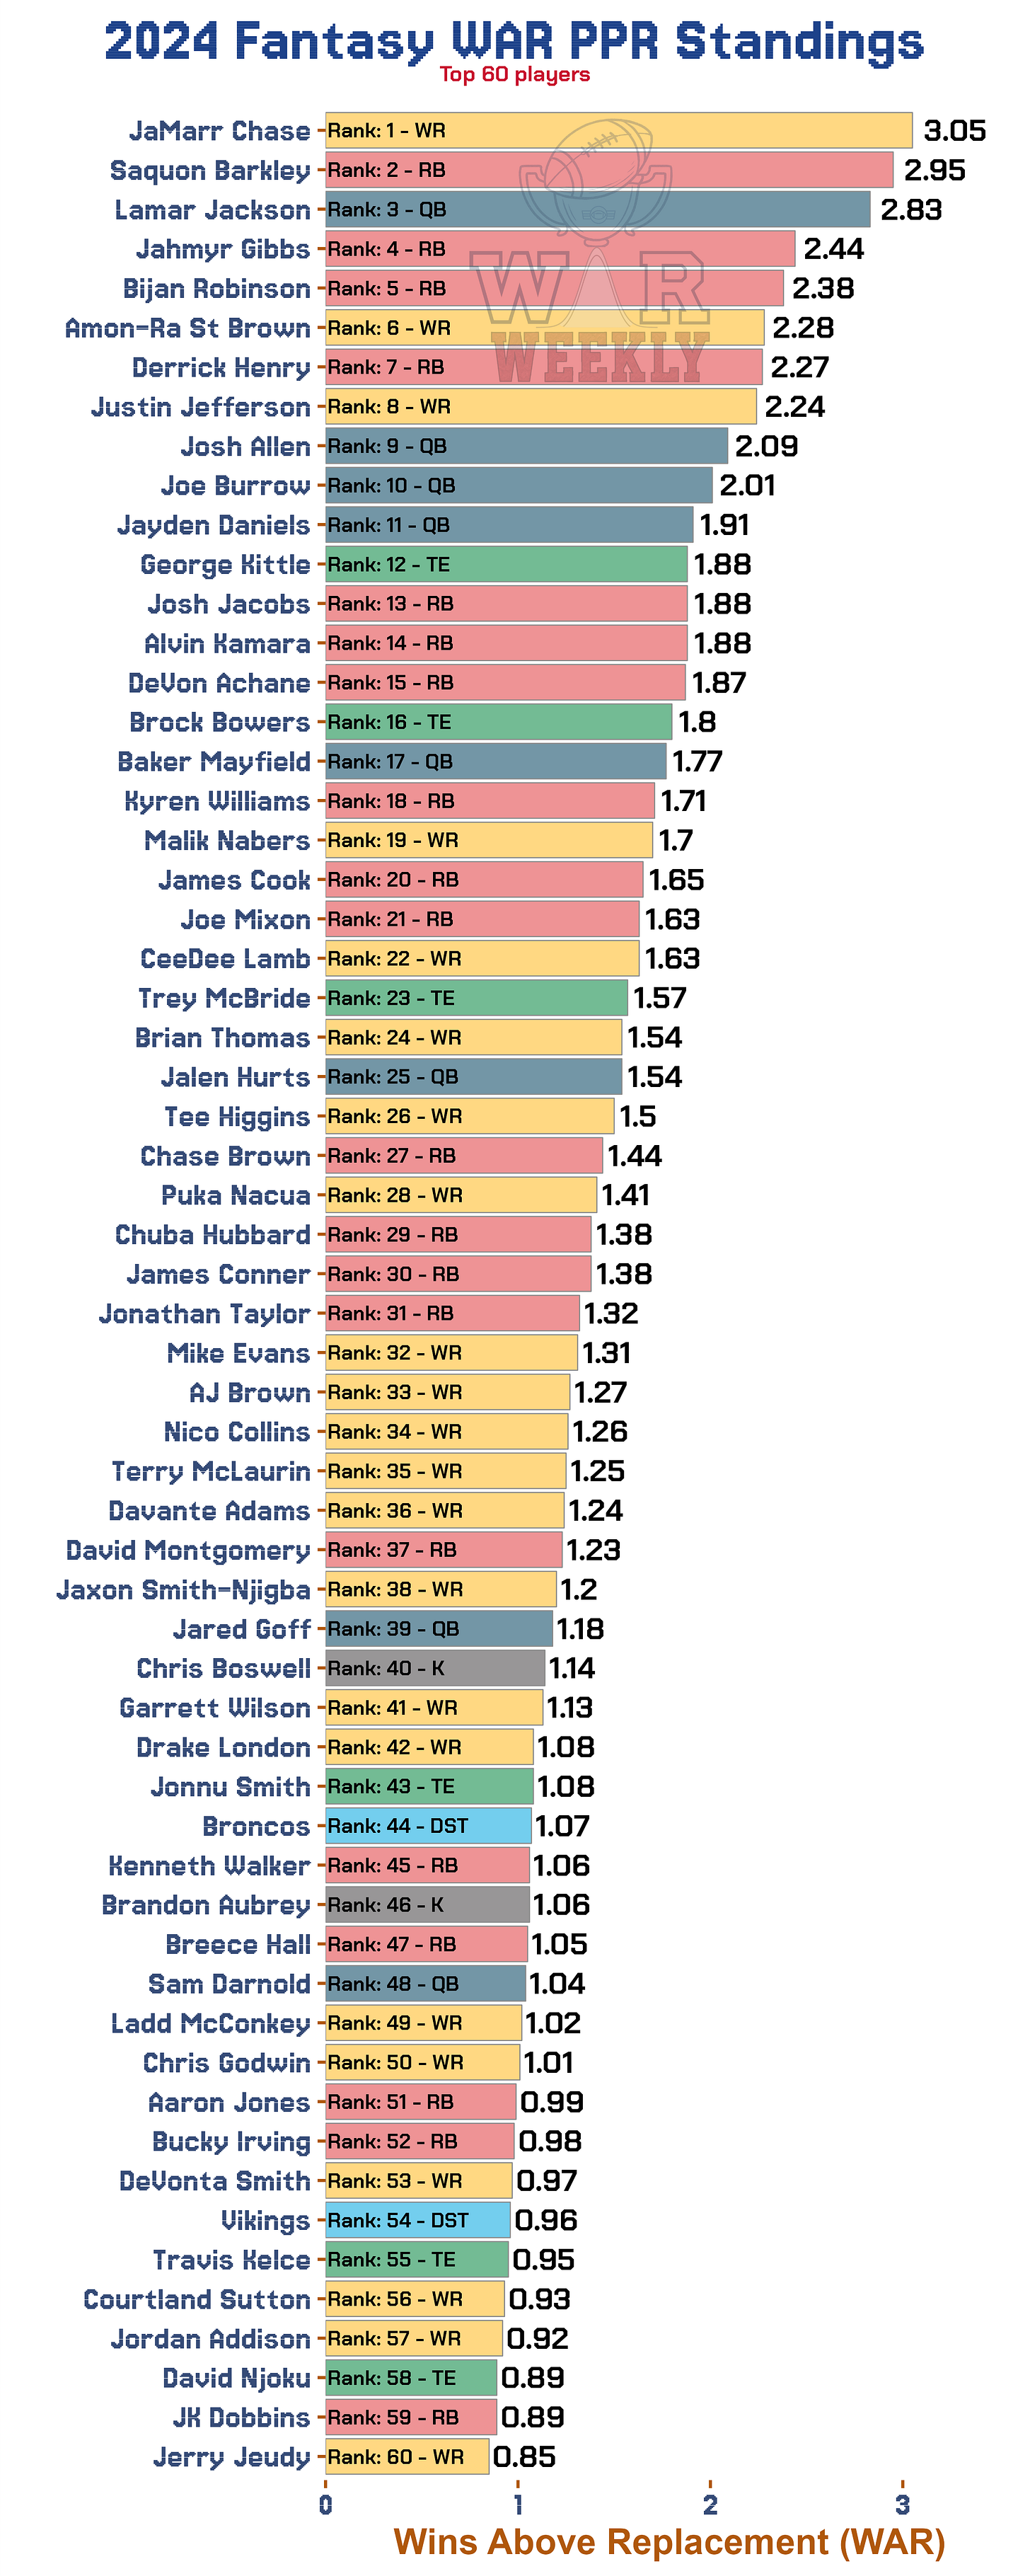
One last time. Back to our draft decision. Bowers. Brown. Or Taylor? Let’s run WAR on the top 60 players in 2024 and give ourselves the proper starting point.
At last. There it is. Your starting point for 2025. And you’ll only find this with WAR Weekly.
There Brock Bowers stands at rank 16, Taylor at 31, and Brown at 33. A huge advantage for Brock Bowers. In fairness - Bowers missed zero games from injury and both Brown and Taylor missed three. The market is likely considering that. But what earthly reason are we to fade Brock Bowers with the exceptional upgrade at QB?
Tell me if you know, because I sure as hell do not. This is a no-brainer. Take Brock Bowers. Use the advantage of proper cross-position equalization telling you the elite tight ends are going to matter more than a higher scoring tier-2 RB/WR. You kind of guessed this might be true at 30,000-ft. You conceptualized how at 15,000-ft. And now you’ve proved it on the ground.
Welcome to WAR Weekly.
Please subscribe. I’m using this season to see if this is worth continuing so most if not all posts for now will be free. The majority of my posts will draw upon this concept of wins above replacement that I created myself and have spent several years tracking and perfecting.
Follow me on Twitter @Statholesports.


